
Main Investment Analysis Ratios
Seven categories. Twenty-five ratios. One quick “report card” for any business.
Quick Answer
What Are the Main Investment Analysis Ratios?
The main investment analysis ratios measure profitability, valuation, dividends, liquidity, leverage, efficiency and market value. Common examples include the P/E ratio, return on equity, profit margins, debt-to-equity, current ratio, asset turnover and enterprise value. Investors should compare several ratios together, against industry peers and over multiple years rather than relying on one number alone. Our valuation and ratios visual lessons work through each measure with a worked example.
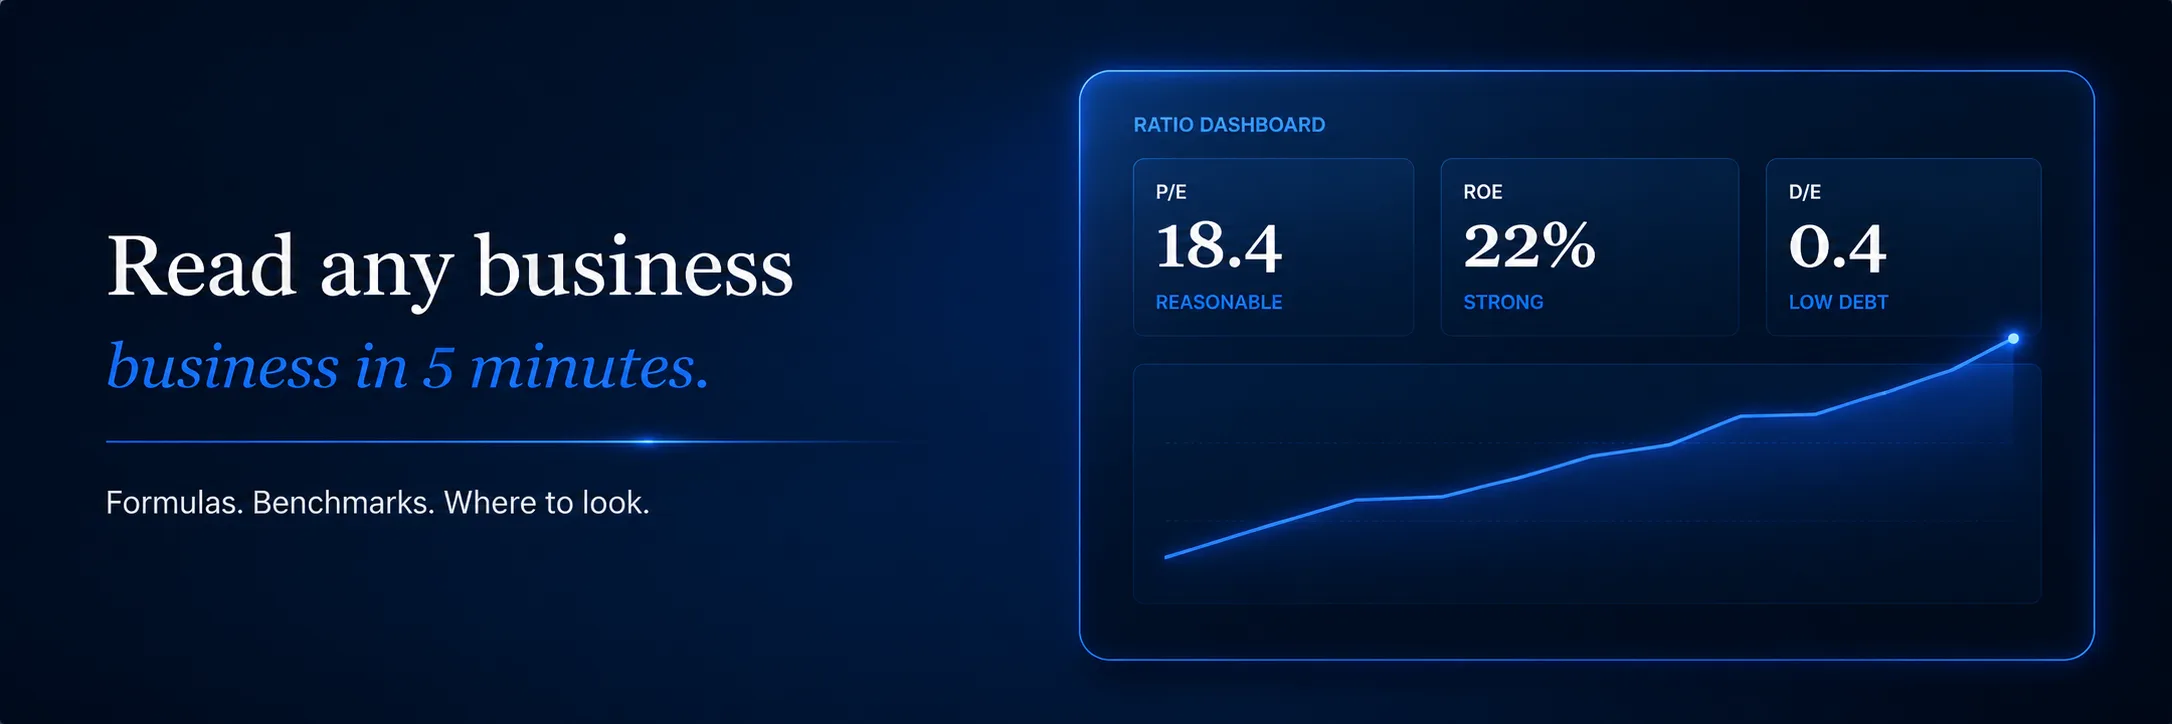
Investment analysis ratios turn complex financial statements into quick “report cards” so investors can compare companies at a glance. They are the universal language of fundamental analysis — used by Warren Buffett, every Wall Street analyst, and increasingly by retail investors with access to free data. If the three statements still feel abstract, our financial statements visual lessons walk through each one a page at a time.
Use them to judge profitability, debt load, growth potential, valuation, liquidity, efficiency, and market size• None of these ratios is meaningful in isolation. Together they form a mosaic that reveals what kind of business you are actually looking at.
This lesson walks all seven categories. For each ratio, we include the Formula, What It Is, Where To Look, and a general Ideal Value.
Important. No ratio is good or bad in isolation. Every ratio must be compared against companies in the same industry and sector. A P/E ratio of 30 may be cheap for a fast-growing technology company and expensive for a mature utility. A debt-to-equity ratio of 2.0 is normal for a bank and alarming for a retailer. A gross margin of 20% is strong for a supermarket and weak for a software business. Always benchmark against industry peers and look at multi-year trends, not a single data point.
|
7
Categories |
25
Individual ratios |
~15%
Strong ROE benchmark |
Beginner Question 1
Profitability and Core Valuation Ratios
How efficiently a company turns sales into profit, plus the first price-to-earnings check most beginners use. This is the first section many investors review.
1.1 P/E Ratio (Price to Earnings)
Formula. P/E = Price per Share ÷ Earnings per Share
What it is. How much investors pay for $1 of earnings. Higher often = higher growth expectations.
Where to look. Price (quotes), EPS (income statement / company sites).
Ideal value. <15 often “reasonable,” but sector-dependent.
1.2 ROE (Return on Equity)
Formula. ROE = Net Income ÷ Average Shareholders’ Equity
What it is. Profit generated on shareholders’ capital.
Where to look. Net income (income stmt); equity (balance sheet).
Ideal value. ≥15% typically strong. Buffett’s threshold is 20%+.
1.3 Net Profit Margin
Formula. Net Profit Margin = Net Income ÷ Revenue
What it is. Profit per dollar of sales.
Where to look. Income statement.
Ideal value. 10–15%+ is common “good,” varies by industry.
1.4 Gross Margin
Formula. (Revenue − COGS) ÷ Revenue
What it is. % left after direct costs.
Where to look. Revenue & COGS (income statement).
Ideal value. ~50%+ strong in many sectors (context matters).
1.5 Operating Margin
Formula. Operating Income ÷ Revenue
What it is. Profit after operating costs.
Where to look. Income statement.
Ideal value. >15% often solid.
1.6 ROA (Return on Assets)
Formula. ROA = Net Income ÷ Total Assets
What it is. Efficiency of turning assets into profits.
Where to look. Net income (income stmt); assets (balance sheet).
Ideal value. ~10–15%, good (industry-specific).
Beginner Question 2
Valuation Ratios
How expensive a company is relative to what it produces. Critical for deciding when to buy.
2.1 P/B Ratio (Price to Book)
Formula. P/B = Price per Share ÷ Book Value per Share
What it is. Price vs. accounting net assets.
Where to look. Price (quotes); BVPS = (Assets – Liabilities) / Shares.
Ideal value. 1–3 sometimes “cheap,” depends on sector.
2.2 PEG Ratio (Price/Earnings to Growth)
Formula. PEG = P/E ÷ Projected Annual EPS Growth (%)
What it is. Growth-adjusted valuation.
Where to look. P/E (calc/quotes); growth (analyst estimates / company).
Ideal value. <1.0 may indicate undervaluation.
2.3 P/S Ratio (Price to Sales)
Formula. P/S = Price per Share ÷ Sales per Share
What it is. Price vs. revenue (useful when earnings are minimal).
Where to look. Price (quotes); Sales per Share = Revenue / Shares.
Ideal value. 1–2 common; compare to peers.
2.4 Enterprise Multiple (EV/EBITDA)
Formula. EV/EBITDA = Enterprise Value ÷ EBITDA
What it is. Entire firm value vs. operating earnings.
Where to look. EV = Mkt Cap + Pref + Debt + Minority – Cash; EBITDA (income stmt / IR).
Ideal value. <10 often attractive (industry-specific).
2.5 EV/Revenue
Formula. EV/Rev = Enterprise Value ÷ Revenue
What it is. Capitalization vs. top-line sales.
Where to look. EV (calc); revenue (income stmt).
Ideal value. Lower better; judge vs. sector norms.
“The stock market is filled with individuals who know the price of everything, but the value of nothing.”
— Philip Fisher
Beginner Question 3
Dividend Ratios
Cash returns to shareholders. The bread and butter of income investors.
3.1 Dividend Payout Ratio
Formula. Dividends ÷ Net Income
What it is. Portion of profits paid out.
Where to look. Dividends (CF stmt / announcements); net income (income stmt).
Ideal value. Contextual; sustainable payout preferred.
3.2 Dividend Yield
Formula. Annual Dividends per Share ÷ Share Price
What it is. % cash return from dividends.
Where to look. Company announcements; quotes.
Ideal value. Industry-dependent; balance yield vs. growth.
3.3 Dividends per Share (DPS)
Formula. (Total Dividends – Special Dividends) ÷ Ordinary Shares
What it is. Cash per ordinary share.
Where to look. Announcements / IR / shares outstanding (filings).
Ideal value. No single best — stability and growth matter.
Beginner Question 4
Liquidity Ratios
Can the company pay its short-term bills? Three views of the same question, each stricter than the last.
4.1 Current Ratio
Formula. Current Assets ÷ Current Liabilities
What it is. Ability to meet short-term obligations.
Where to look. Balance sheet.
Ideal value. >1 generally acceptable. 1.5–3 is healthy.
4.2 Quick Ratio
Formula. (Current Assets – Inventory) ÷ Current Liabilities
What it is. Stricter liquidity (excludes inventory).
Where to look. Balance sheet.
Ideal value. >1 usually healthy.
4.3 Cash Ratio
Formula. Cash & Equivalents ÷ Current Liabilities
What it is. Pure cash coverage of near-term debts.
Where to look. Balance sheet.
Ideal value. >1 indicates strong position.
Beginner Question 5
Leverage Ratios
How much debt the company carries. Critical for spotting financial fragility before it becomes a crisis.
5.1 Debt-to-Equity (D/E)
Formula. Total Liabilities ÷ Shareholders’ Equity
What it is. Debt level relative to equity.
Where to look. Balance sheet.
Ideal value. 10–30% low; 50%+ higher risk (rules of thumb).
5.2 Interest Coverage
Formula. EBIT ÷ Interest Expense
What it is. Ability to pay interest from operating profit.
Where to look. Income statement.
Ideal value. >1 minimum; higher is safer. Buffett looks for 8x+.
5.3 Debt Ratio
Formula. Total Liabilities ÷ Total Assets
What it is. Portion of assets financed by debt.
Where to look. Balance sheet.
Ideal value. Compare within industry.
Beginner Question 6
Efficiency Ratios
How well the company uses its assets. Higher numbers usually indicate better management.
6.1 Asset Turnover
Formula. Revenue ÷ Total Assets
What it is. Sales per dollar of assets.
Where to look. Income statement & balance sheet.
Ideal value. Higher = better (industry-specific).
6.2 Inventory Turnover
Formula. COGS ÷ Average Inventory
What it is. Speed of selling / replenishing inventory.
Where to look. Income statement & balance sheet.
Ideal value. Higher suggests efficient stock management.
6.3 Receivables Turnover
Formula. Net Credit Sales ÷ Average Accounts Receivable
What it is. Collection efficiency.
Where to look. Sales & A/R (filings / notes).
Ideal value. Higher generally better.
6.4 Payables Turnover
Formula. Net Credit Purchases ÷ Average Accounts Payable
What it is. How quickly suppliers are paid.
Where to look. Purchases / AP (filings / notes).
Ideal value. Higher = faster payment; compare to norms.
Beginner Question 7
Market Value Ratios
How the market is currently pricing the entire enterprise.
7.1 Market Capitalization
Formula. Share Price × Shares Outstanding
What it is. Public market value of equity.
Where to look. Price (quotes); shares (filings / IR).
Ideal value. N/A — use for scale / peer grouping.
7.2 Enterprise Value (EV)
Formula. EV = Market Cap + Preferred Equity + Total Debt + Minority Interest − Cash & Equivalents
What it is. Whole-company valuation (debt / cash adjusted).
Where to look. Components in balance sheet & quotes.
Ideal value. Compare via multiples (EV/EBITDA, EV/Rev).
7.3 Book Value per Share (BVPS)
Formula. Shareholders’ Equity ÷ Ordinary Shares
What it is. Equity per common share.
Where to look. Balance sheet; shares (IR / filings).
Ideal value. Compare BVPS to price (P/B).
Final Tips
Best practices for using ratios
Use Ratios Together. Build a mosaic, not a single-metric verdict.
Compare Within Industry. Benchmarks differ across sectors. A 20% net margin is excellent for retail and mediocre for software.
Track Trends. Multi-year direction beats a single snapshot. Improving trends matter more than one year’s number.
Watch Footnotes. Definitions (e.g., EBITDA, “adjusted earnings”) can vary by company. Read the fine print.

Final Takeaway
Six things to take from this guide
| 01 | 7 categories cover the entire ratio toolkit: profitability, valuation, dividends, liquidity, leverage, efficiency, market value. |
| 02 | P/E, ROE, and Net Profit Margin are the three “must check first” ratios. |
| 03 | Always compare within industry — software has 50%+ margins, retail has 5%. |
| 04 | Track multi-year trends — direction matters more than one snapshot. |
| 05 | PEG < 1 may signal undervaluation — but only after sanity-checking growth assumptions. |
| 06 | No single ratio is the answer. Use them together as a mosaic. |
Five Commitments
What you commit to before the next guide
Read each one. If you cannot honestly commit to it, the lesson is not finished.
| I. | I will check P/E, ROE, and D/E for every stock I consider. |
| II. | I will compare every ratio to at least 2 industry peers before judging it. |
| III. | I will look at 5-year trends, not just the latest year. |
| IV. | I will read the footnotes on “adjusted” or “non-GAAP” metrics. |
| V. | I will never make a buy decision on a single ratio in isolation. |
End of Guide
Free Course . Continue to Taxation Basics.
Primary sources and further reading
Use these references to check the definitions, methods and risks discussed in this guide. Examples are for learning and do not predict investment results.- SEC: Beginners’ Guide to Financial Statements
- SEC Investor.gov: Price-to-Earnings Ratio
- FINRA: Evaluating Stocks
- SEC Investor.gov: Using EDGAR to Research Investments
Education only. This guide provides general information, not personal investment, financial or tax advice. Check current rules and official filings before making a decision.


