
Free visual lessons
One investing idea per picture, from what a share is to how economic cycles turn. Search any word, pick a topic and open any diagram full size. Free, no account.
FreeNo accountEvery major topic
Type a word or pick a topic. The diagrams update as you type.
Popular:
How a share is a piece of a company, how exchanges work and how to read a quote.
Why people invest, the main types of investment and the asset classes behind them.
How spreading money across assets, sectors and markets can reduce needless swings.
 Portfolio Diversification
 Portfolio DiversificationDiversification
 Portfolio Risk
 Asset Allocation
 Asset AllocationAsset Allocation Example
 Conservative PortfolioConservative Portfolio Example
 Risk Management
 Investment Risk Pyramid
 Risk vs ReturnRisk Return Relationship
 Risk vs ReturnRisk Return for Asset Classes
 Risk vs Return
 Risk vs ReturnAsset Risk Return
Value investing, dollar cost averaging, time horizons and setting your objectives.
 Value Investing
 Value Investing
 Value InvestingValue Investment Example
 Dollar Cost AveragingDollar Cost Averaging Example
 Dollar Cost Averaging
 Investment Strategies
 Long Term InvestingLong Term Investment Strategies
 Margin of SafetyMargin of Safety Explanation
 Margin of SafetyMargin of Safety Example
 Investment HorizonInvestment Period Horizon
 Investment HorizonInvestment Horizon Example
 Investment HorizonInvestment Horizon Period Timelines
 Investment Objectives
 Investment Objectives
 Investment ObjectivesInvestment Objective Factors
 Investment ObjectivesObjective of Investment
How investors judge business quality, financial strength and long term value.
Income statements, balance sheets, liabilities and how profit is worked out.
 Income Statement
 Income Statement
 Balance Sheet
 Balance SheetBalance Sheet Example
 Assets vs Liabilities
 Assets vs LiabilitiesAssets Liabilities
 Types of Liabilities
 Types of Liabilities
 Financial StatementsTypes of Financial Statements
 Financial Statements
 Net ProfitThe Net Profit Formula
 Net ProfitNet Profit Formula
 Gross vs Net ProfitGross Profit vs Net Profit
What a business may be worth beyond its price, and the ratios investors use to judge it.
 Intrinsic Value
 Intrinsic ValueHow to Determine Intrinsic Value
 Intrinsic ValueIntrinsic Value of a Company
 Valuation Methods
 Market Price vs Intrinsic Value
 Market Price vs Intrinsic Value
 P/E RatioPrice to Earnings P/E Ratio
 P/B RatioPrice to Book Ratio
 ROEReturn on Equity
 EPS
 EPSEarnings Per Share
 Best Financial Ratios
 Valuation RatiosThe Best Valuation Ratios
 Valuation RatiosInvestment Ratios Example
 Alpha vs Beta
How dividends work, why reinvesting them compounds and the dates that decide who is paid.
How index funds and ETFs bundle many stocks into one investment, and how REITs work.
Price action, candlesticks, trends, moving averages and volume, read rather than predicted.
 Technical Analysis
 Technical AnalysisFundamentals vs Technical Analysis
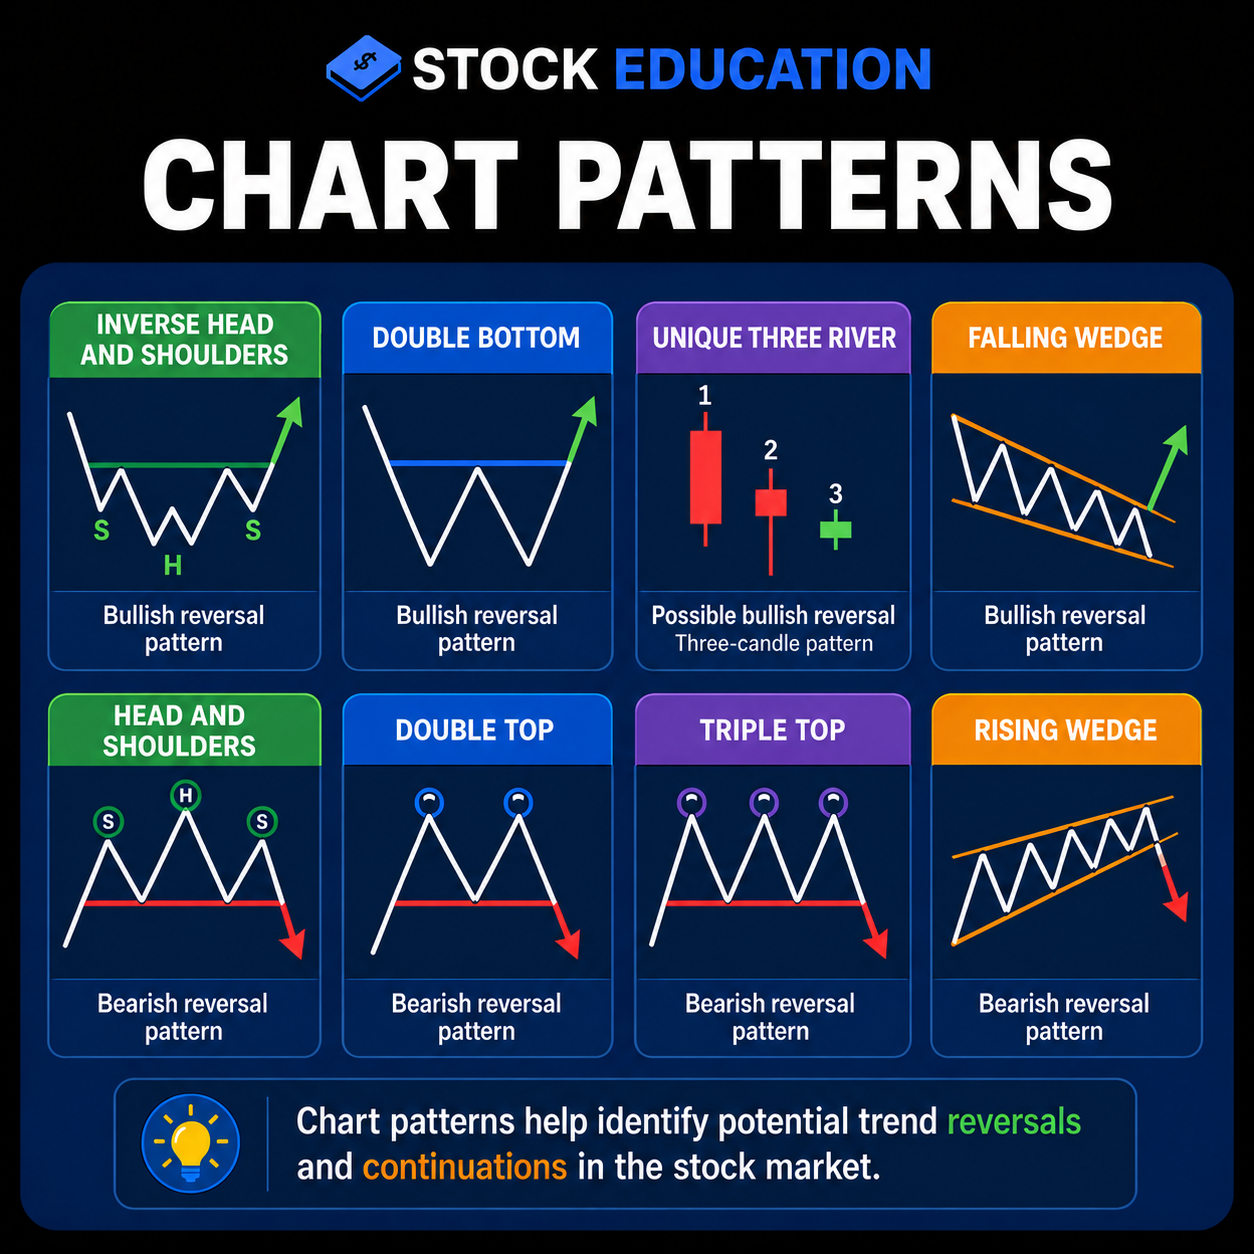 Chart Patterns
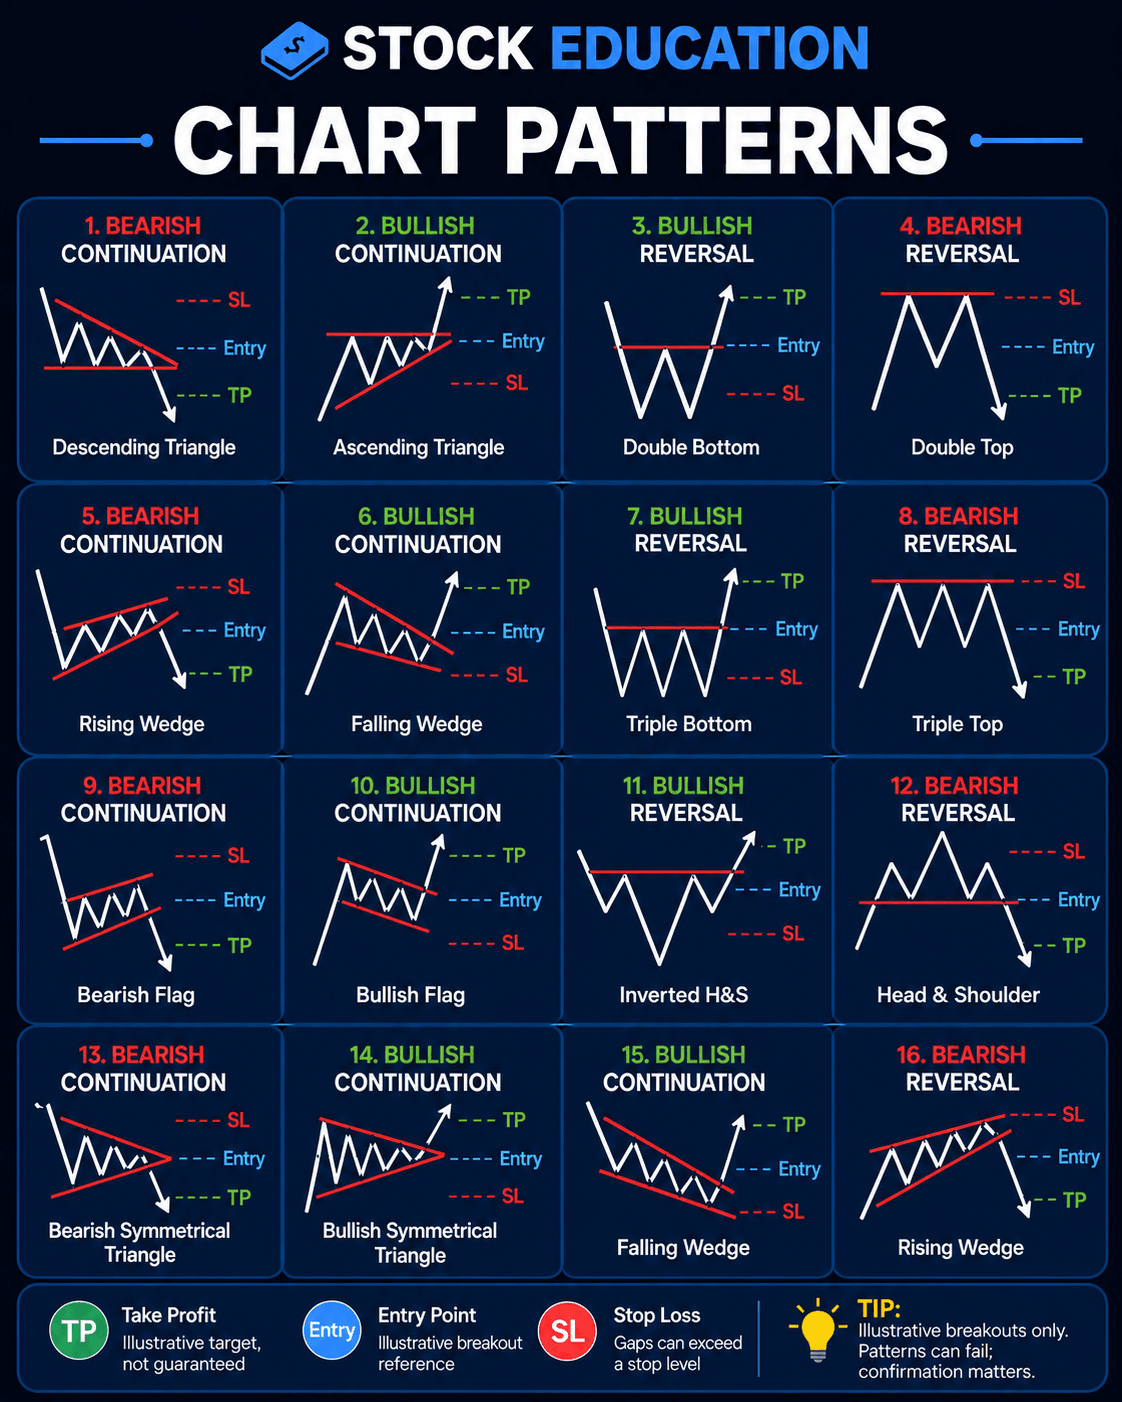 Chart Patterns
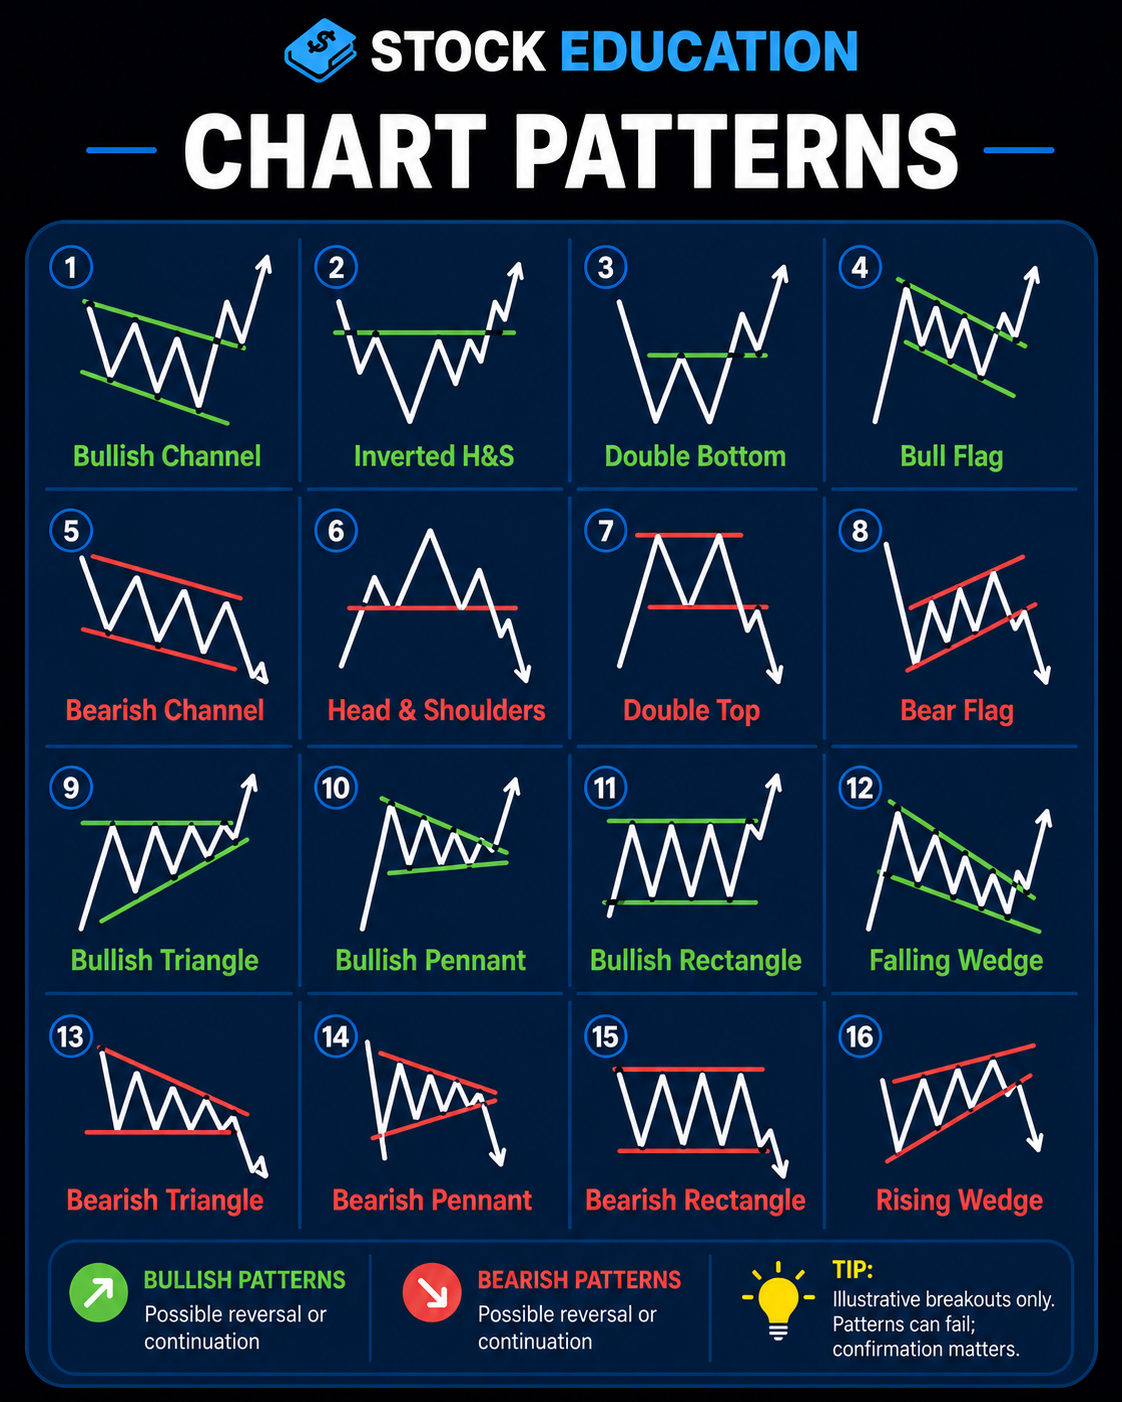 Chart Patterns
 CandlesticksCandlestick Chart
 Candlesticks
 Candlestick PatternsCandlestick Chart Patterns
 Moving Averages
 Moving AveragesMoving Average Signals
 Moving Averages
 RSIRSI Explained
 Trends
 Volume SpikesVolume Spike Example
 Types of Stock Charts
Market, limit and stop orders, brokerage fees and how a purchase actually happens.
Why investors follow the crowd, the emotions of a market cycle and the biases that cost money.
 Herd Mentality
 Herding BehaviorHerding Behavior Examples
 Market Psychology
 Trading Psychology
 Market Emotions Cycle
 Market Emotions CycleMarket Cycles Emotions
 Fear and Greed IndexFear Greed Index
 Fear and Greed IndexFear Greed Index
 Cognitive BiasesCognitive Biases Example
 Cognitive BiasesBehavioral Finance Cognitive Biases
 Behavioral Finance
 Behavioral Economics
 Greater Fool TheoryAvoid Greater Fool Theory
 Mr MarketMr Market's Moods
The indicators, inflation, interest rates and cycles that move the whole market.
 Economic IndicatorsKey Economic Indicators
 Economic IndicatorsKey Economics Indicators
 Economic ConceptsTop Economic Concepts
 Economic Equilibrium
 InflationCoffee Inflation Example
 InflationInflation Example
 CPIConsumer Price Index Chart
 DeflationDeflation Causes
 Economic CyclesFour Economic Cycle Phases
 Economic Cycles
 Economic Cycles
 Micro vs Macro EconomicsMicroeconomics vs Macroeconomics
 Flow of Economic Activity
 Banking Factors
 Interest RatesHow Interest Rates Work
Who trades, how sectors and countries weigh in, bull and bear markets, cycles and bubbles.
 Market ParticipantsTypes of Market Participants
 Global Stock ExchangesGlobal Stock Exchange Weights
 Global Stock MarketsGlobal Stock Markets Example
 Stock Market SectorsTypes of Industries in Stock Market
 Stock Market Sectors
 Stock Market Sectors
 Stock Market Sectors
 Stock Market SectorsSectors in the Stock Market
 Sector WeightsGlobal Stock Market Sectors Weights
 Bull vs Bear MarketsBull vs Bear Market
 Bull vs Bear MarketsBull vs Bear Market
 Bull vs Bear Markets
 Stock Market CyclesBull Bear Market Phases
 Stock Market CyclesStages of a Stock Market Cycle
 Stock Market CyclesStock Market Cycle Psychology
 Stock Market CyclesMarket Cycle Stages
 BubblesStages of a Stock Market Bubble
 Dow JonesDJIA Weekly 1929 Crash
 Dow JonesDow Jones Industrial Average
No diagrams match that word. Try a broader word, or tap All topics.
A free collection of investing diagrams, grouped by topic. Each one explains a single idea, such as what a stock is, how a balance sheet is laid out, what a moving average shows or how a market cycle turns, in one picture with a short title. Search any word, swipe through a topic and tap any card to open the diagram full size. It is a fast way to see an idea before the free course explains it in full.
 Reviewed by Associate Professor Charles Lo, CPA, PhD · Updated 14 October 2026
A diagram shows the idea. These take you through it properly, in order.
A free collection of investing diagrams grouped by topic, each explaining one idea in one picture: what a stock is, how a balance sheet is laid out, how a moving average works, how a market cycle turns. Search it, swipe through a topic, and open any diagram full size.
Yes. Every diagram is free to view and open full size, with no account, no card and no email. The free course, the simulator, the tools and the glossary are free too.
Complete beginners who understand an idea faster by seeing it, and anyone revising before a quiz. Each diagram stands on its own, so you can dip in for a single idea.
With Stock Market Basics, then Investing Fundamentals and Portfolio Construction. The topics run roughly in the order the free course teaches them, from your first share to valuation, charts, psychology and the economy.
Stock market basics, investing fundamentals, portfolios and risk, strategies, fundamental analysis, financial statements, valuation and ratios, dividends, ETFs and funds, chart reading, order types, market psychology, economics, and markets and sectors.
Type a word such as dividend, moat or RSI into the search box, or tap a topic. Matching diagrams stay on the page and the rest step aside, so you can jump straight to the one you need.
Yes. Tap or click any card and the full size diagram opens, ready to zoom on a phone. The cards are small previews so the library loads quickly.
No. A diagram shows one idea at a glance. The free course explains it in order, with examples and a quick check after each lesson. Use the two together.
Yes. They are reviewed by the editorial team under the same standards as the lessons, and confirmed errors are fixed and logged. The chart pattern diagrams, for example, were corrected on 7 October 2026.
No. The diagrams are general education about how markets and investing work. They do not recommend any stock, fund or strategy for you.
Lesson 1 needs no account. The learning path then puts every lesson, quiz and tool in order and saves your place.
FreeNo cardEducation, not advice
Free beginner guide
4.9/5 · 24 reviews on Shopper Approved (opens in a new tab)The basics, plus how to check every number AI gives you. Free, straight to your inbox.
Free PDF in your inbox. No spam. Unsubscribe any time.
Learning Path IncludedEvery lesson in the right order, freeGet the Free Guide

Get instant educational answers about
stocks, investing, and StockEducation.com.
Educational support only. Not personal financial advice. AI responses may contain errors.
Powered by AI ●

A beginner friendly guide that covers the essential lessons and concepts every new investor should understand.
Inside You'll Learn
I can explain how investing works. I cannot tell you what to buy or what is right for your situation.
I can be wrong. Check anything important against a primary source. For decisions about your own money, speak to someone licensed.


